|
Euler Diagram Applications
Euler diagrams are used in a wide range of application areas, here are a few
examples:
Medicine
Metrical
Venn Diagrams
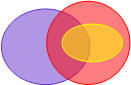
The
Proportional Venn Diagram of Obstructive Lung Disease
Chronic
kidney disease care delivered by US family medicine and internal medicine
trainees: results from an online survey
An Overview of
9/11 Experiences and Respiratory and Mental Health Conditions among World Trade
Center Health Registry Enrollees
Dyslipidemias and obesity in Mexico
Mortality in
British military participants in human experimental research into chemical
warfare agents at Porton Down: cohort study
Scaled rectangle diagrams can be used to visualize clinical and epidemiological data
Displaying clinical data relationships using scaled rectangle diagrams
Plasmodium vivax and Mixed Infections Are Associated with Severe Malaria in Children: A Prospective Cohort Study from Papua New Guinea
Biology
Transcript
Profiling and Identification of Molecular Markers for Early Microspore
Embryogenesis in Brassica napus
Quantitative
Whole-Cell Proteome Analysis of Pseudorabies Virus-Infected Cells
Comparison of Gene Expression Profile in Embryonic Mesencephalon and Neuronal
Primary Cultures
BioVenn – a web application for the comparison and visualization of biological
lists using area-proportional Venn diagrams
VennMaster: Area-proportional Euler diagrams for functional GO analysis of
microarrays
Time-resolved
determination of the CcpA regulon of Lactococcus lactis spp. cremoris MG1363
Phenon cluster analysis as a method to investigate epidemiological relatedness between sources of Campylobacter jejuni
Education
Visualizing
Multiple Regression
That was Venn,
this is now
Data Mining and Visualization
Agent-based visualization of streaming text
A new metaphor
for projection-based visual analysis and data exploration
Diversity partitions in 3-way sorting: functions, Venn diagram mappings, typical
additive series, and examples
Crime Prevention
Repeat Victimization and Hot Spots: the Overlap and Its Implications for crime
Control and Problem-Oriented Policing
A complex problem: Appropriate care for addicted individuals with co-morbid
psychiatric problems and a mild mental retardation
Paleontology
Measurement
of Faunal Similarity in Paleontology
Web Search
Improving
web search transparency by using a Venn diagram interface
Transnational anti-war activism: Solidarity, diversity and the Internet in
Australia, Britain and the United states after 9/11
File Management
VennFS2
Patent Applications
Method and System for Generating a Graphical Representation. It does not appear to have been granted.
|