This web page outlines a full day tutorial offered at VL/HCC 2009.
The automated generation and layout of diagrams is key to the usability of visual languages. The techniques explained in this tutorial enable the automated generation and layout of diagrams, as well as the enhancement of the layout of manually drawn diagrams.
The first part of the tutorial overviews application areas and the state-of-the-art in graph drawing and Euler diagram drawing, two of the most common diagrammatic formalisms for visual languages. Software will be used to demonstrate many of the layout methods. The second part looks at layout in practice, which draws on many of the concepts introduced in the first part and is again supported by diagram layout software.
We assume a total of seven hours contact time, segmented by appropriate rest breaks. Tutees will be required to bring laptops with Java 1.6 installed, the layout software will be provided at the tutorial. Download Java here.
The following is an outline of the tutorial content.
1. Morning: Application Areas and the State-of-the-Art in Diagram Layout Techniques
9:00 - 9:15: Introduction
9:15 - 9:45: 1.1. Application Areas
Section 1.1 Slides- Uses of graphs. Examples in areas such as flow based visual languages and software engineering diagrams (Figure 1).
- Uses of Euler diagrams. Examples in areas such as the visual representation of set theory and information visualization (Figure 2), including area proportional diagrams.
- Use of notations that combine graphs and Euler diagrams in logic based visual languages.
9:45 - 10:30: 1.2. Graph Drawing Techniques
Section 1.2 Slides- Force directed approaches (Figure 3). Barycentre methods and the spring embedder, including the metric spring embedder.
- Multi-criteria approaches. Metrics and optimising techniques, including at studies into the effectiveness of various metrics.
- Planar graph layout.
- A brief overview of hierarchical and orthogonal drawing methods.
10:30 - 11:00: Coffee Break
11:00 - 11:30: 1.3. Introducing Euler Diagrams
Section 1.3 Slides- Defining Euler diagrams, including concepts such as zones, contours, and graph duals.
- Properties of Euler diagrams: triple points, concurrent lines, non-simple curves, and the use of different shapes to draw contours.
11:30 - 12:00: 1.4. Euler Diagram Layout Techniques
Section 1.4 Slides- Overview of embedding processes.
- Comparing the dual graph embedding process with inductive methods and the techniques of Chow and Ruskey.
12:00 - 12:30: 1.5. Diagram Layout in Applications
Section 1.5 Slides- Integrating graph drawing and Euler diagram layout for use in logic languages.
- Diagram labelling techniques. Methods for placing text in graphs and Euler diagrams.
12:30 - 14:00: Lunch
2. Afternoon: Layout in Practice
In the second part we take a step-by-step approach to the generation of general Euler diagrams (figures 4 and 5). Examples and exercises will be based on software that implements the method described. The demonstrated approach combines the methods discussed in 1.4 and relies on the practical application some of the techniques given in 1.2. The generation process breaks down into these steps.
14:00 - 15:30: 2.1. Finding the Dual Graph
Section 2.1 Slides- Generating a superdual graph from an abstract diagram.
- Methods for forming a planar dual graph from the superdual.
- Techniques to improve the properties of the diagram by modifying the planar dual.
15:30 - 16:00: Coffee Break
16:00 - 17:30: 2.2. Embedding the Diagram
Section 2.2 Slides- Improving the layout of the dual graph with a modified spring embedder.
- Wrapping contours around a triangulated dual graph to form the Euler diagram.
- Multi-criteria methods for improving the layout of embedded diagrams.
Software for the tutorial:
The Organizers
Prof. John Howse is Professor of Mathematics and Computation at the University of Brighton, UK, where he is leader of the Visual Modelling Research Group. His main research interests are diagrammatic reasoning, the development of visual modelling languages and automated diagram drawing. He is on the program committee for several international conferences, was General Chair of Visual Languages and Human-Centric Computing 2006, is on the steering committee for the Diagrams conference series and was Program Chair for Diagrams 2008. He received the Best Paper Award at Diagrams 2002, as co-author of the first paper on automated Euler diagram drawing. He is the Principal Investigator on the Visualization with Euler Diagrams project, at the Brighton site, which is developing advanced techniques to automate the Euler diagram drawing process.
Dr. Peter Rodgers is a Senior Lecturer in Computer Science at the University of Kent, UK. He has been teaching graph algorithms and diagram drawing at undergraduate and postgraduate level for over ten years. He has been an author on over 30 peer reviewed publications in diagram visualization and algorithms. These papers include descriptions of work on extending force directed layout and improving the performance of graph layout algorithms. They also detail his research in Euler diagram visualization, such as the first aesthetics based visualization method for Euler diagrams, and producing the first empirical study on the usability of Euler diagrams. He chaired the first Euler diagrams workshop in 2004 and is the Principal Investigator on Visualization with Euler Diagrams at the Kent site.
Dr. Gem Stapleton is a Senior Research Fellow at the University of Brighton, UK. She has been teaching undergraduate level mathematics and computing subjects since 2001, including relevant topics such as graph theory and diagrammatic reasoning. Her research interests encompass diagrammatic logics, with an emphasis on those based on Euler diagrams. Dr Stapleton???s research on automated theorem proving is a particular application area where automated diagram layout is necessary. She has over 30 peer reviewed publications in the visual languages area and has received various awards for her research. She served on various Program Committees in the area of visual languages, was General Chair of Diagrams 2008 and is a Co-Investigator on Visualization with Euler Diagrams.
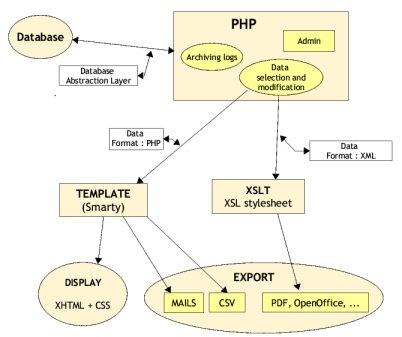
Figure 1. A diagram showing a software system schema
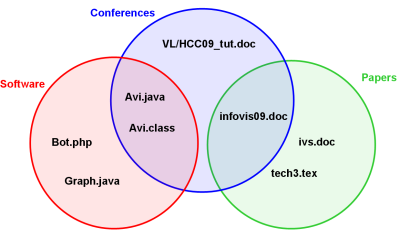
Figure 2. An Euler diagram
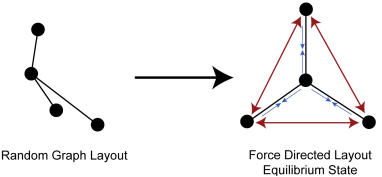
Figure 3. Force directed layout
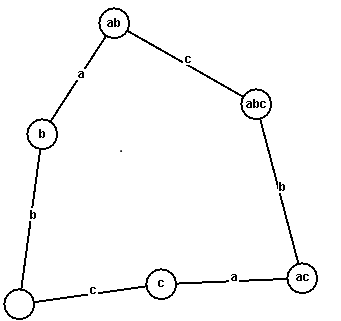
Figure 4. Planar dual created when embedding an Euler diagram
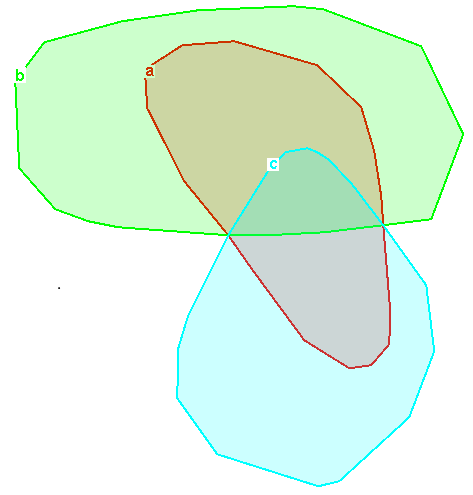
Figure 5. Euler diagram embedded from the above planar dual