This web page outlines a full day tutorial offered at Diagrams 2010.
The automated generation and layout of diagrams is key to the usability of visual languages. The techniques explained in this tutorial enable the automated generation and layout of Euler diagrams, as well as the enhancement of the layout of manually drawn diagrams.
Participants will be presented with an overview of different Euler diagram drawing methods, including their strengths and weaknesses. Various freely available software tools to support their use will be demonstrated. The tutorial will also discuss their use in information visualization, highlighting a range of areas in which they are helpful. Thus, the tutorial should make attendees more aware of the scope for Euler diagram application and the state-of-the-art tools available for their automated generation.
We assume a total of two hours contact time, split by a rest break. Tutees will be required to bring laptops with Java 1.6 plugin or greater installed. Download Java here.
The following is an outline of the tutorial content.
1. Introduction
2. General Embedding
BREAK
3. Area Proportional Diagrams
3.1. General Area Proportional Diagrams Section 3.1 Slides
3.2. Area Proportional Venn-2 and Venn-3 Section 3.2 Slides
4. Tools
5. Conclusion
Software for the Tutorial:
The Presenters
Prof. John Howse is Professor of Mathematics and Computation at the University of Brighton, UK, where he is leader of the Visual Modelling Research Group. His main research interests are diagrammatic reasoning, the development of visual modelling languages and automated diagram drawing. He is on the program committee for several international conferences, was General Chair of Visual Languages and Human-Centric Computing 2006, is on the steering committee for the Diagrams conference series and was Program Chair for Diagrams 2008. He received the Best Paper Award at Diagrams 2002, as co-author of the first paper on automated Euler diagram drawing. He was the Principal Investigator on the Visualization with Euler Diagrams project at the Brighton site, which developed advanced techniques to automate the Euler diagram drawing process.
Dr. Peter Rodgers is a Senior Lecturer in Computer Science at the University of Kent, UK. He has been teaching graph algorithms and diagram drawing at undergraduate and postgraduate level for over ten years. He has been an author on over 30 peer reviewed publications in diagram visualization and algorithms. These papers include descriptions of work on extending force directed layout and improving the performance of graph layout algorithms. They also detail his research in Euler diagram visualization, such as the first aesthetics based visualization method for Euler diagrams, and producing the first empirical study on the usability of Euler diagrams. He chaired the first Euler diagrams workshop in 2004 and was the Principal Investigator on Visualization with Euler Diagrams at the Kent site.
Figure 1. Venn-3 from www.despair.com

Figure 2. An Euler diagram of parts of the British Isles by Sam Hughes
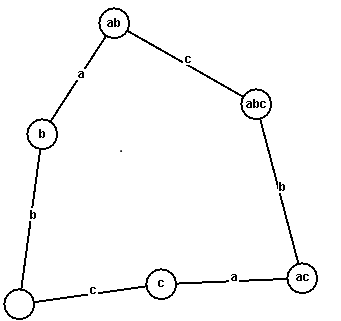
Figure 3. Planar dual of an Euler diagram
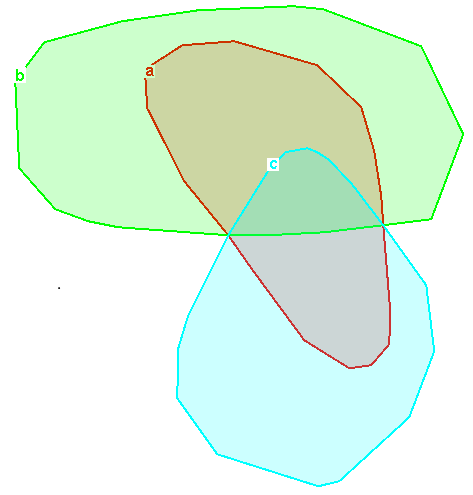
Figure 4. Euler diagram embedded from the above planar dual